Building a desktop dashboard for multi-timeframe analysis with MetaTrader 5, Python, and React
Multi Timeframe Analysis started as a personal project.
I wanted a more comfortable way to follow the market across different timeframes without jumping between windows, charts, and notes all the time. In my own analysis flow, looking at only one period is not enough. The context changes a lot when I compare M1, M5, M15, and M30.
The idea was to build a Windows desktop dashboard connected directly to the MetaTrader 5 installation on the machine. The project uses Python to handle the data and React to create a cleaner interface for organizing the view during analysis.
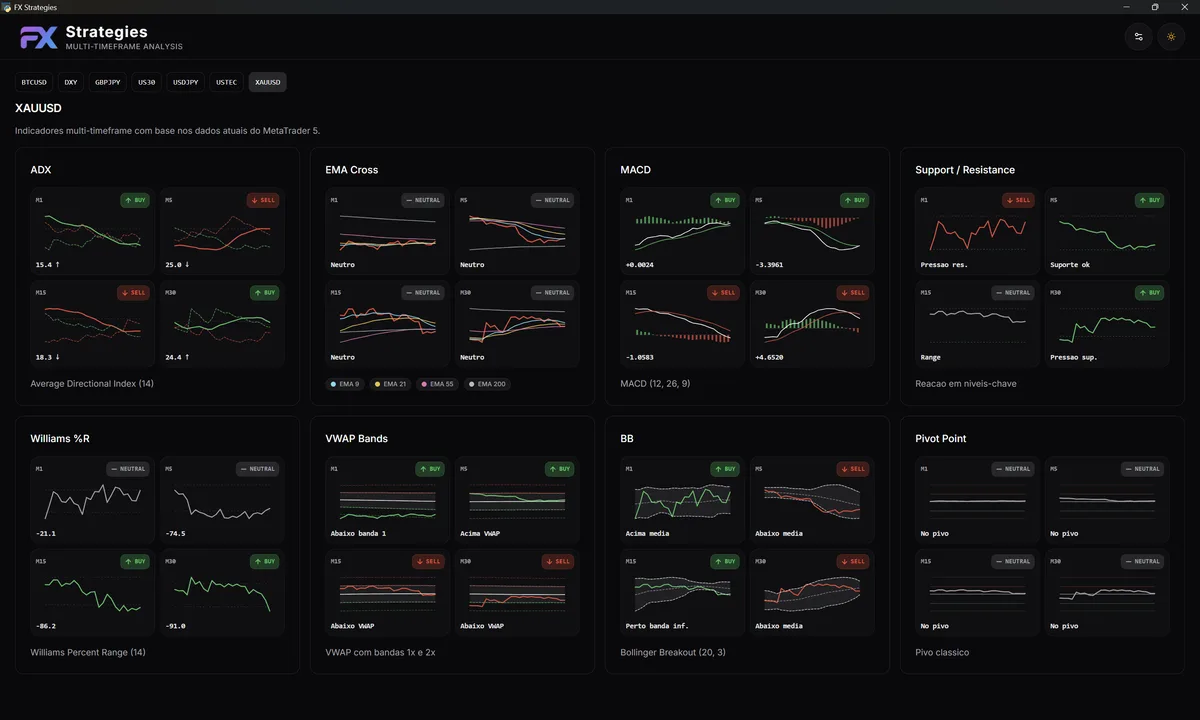
In the repository, the application appears as FX Strategies. The purpose is straightforward: keep several symbols in one workspace and show a compact reading of the short-term timeframes, without depending on a chain of open tabs inside the terminal.
Why I built it
The first goal was not to create a commercial product. It was to solve something I wanted for myself.
I wanted to study how market analysis, MetaTrader 5 data, and a custom interface could work together. I also wanted to move a bit beyond the default terminal experience and try a workflow that felt closer to the way I like to watch the market.
This kind of project interests me because it combines several parts I enjoy building: external integrations, automation, data handling, interface design, and information organization.
How it works
The application connects directly to MetaTrader 5 installed on Windows. From there, Python is responsible for fetching the data and preparing the information for the interface.
On the frontend, I used React with TypeScript to build the dashboard. The interface runs as a desktop application through pywebview, so it feels closer to an installed app than to a page opened in the browser. Communication between both sides goes through the pywebview API bridge: Python organizes the data and React consumes that information to build the screen.
One of the most interesting parts was exactly that: creating something similar to an Electron experience, but with a Python backend. I did not know pywebview well yet, so the project was also a way to understand how to connect a modern web interface with a local Python layer.
I also used SQLite for local persistence. For this kind of application, keeping the data on the machine made more sense than adding an external server. The selected symbols are stored locally, which makes it easier to reopen the tool and continue the analysis without starting from scratch.
What made it into the first version
The first version already includes a few important pieces for the workflow: multiple-symbol monitoring, M1, M5, M15, and M30 views, cards with per-timeframe summaries, and support for light and dark themes.
Even though the indicators and calculations will keep evolving, this base already validates the part I cared about most: turning data from MetaTrader 5 into a more organized workspace, with quick reading and an interface that does not feel improvised.
Technologies used
The backend was built with Python and integrates with MetaTrader 5. The interface uses React, TypeScript, Vite, Tailwind CSS, and TanStack Query. For the desktop layer, I used pywebview, and for creating a Windows executable, PyInstaller.
The technology choices came from the problem itself. Python makes the data and MetaTrader integration easier. React helps build a more flexible interface. SQLite handles local persistence without adding unnecessary complexity.
What I learned
This project reminded me that the challenge is not only fetching data or putting a screen together. The important part is making the pieces talk to each other well.
When an application depends on MetaTrader 5, a Python backend, local persistence, and a React interface, small rough edges become visible quickly. The data flow needs to be clear. The interface needs to respond well. And the structure needs to allow changes without becoming messy.
It was also a good UI/UX exercise. In market analysis, too much information can get in the way. The value is in organizing what matters so the reading becomes faster, without turning the screen into a confusing panel.
Next steps
There is still a lot of room to evolve Multi Timeframe Analysis.
One next step is to allow indicator parameters to be configured from the interface, so calculations can become more dynamic. That would make the tool more flexible for different analysis styles.
I also want to add correlation calculations between currency pairs. The first idea is to validate that logic in a more controlled way and then allow pairs to be selected directly from the interface.
Further ahead, the goal is to build trading automation robots based on pair correlations and indicator confluences. That part still needs care, testing, and validation, but it is a natural direction for the project.
Project code
The project is available on GitHub: